Introduction
The main purpose of the tutorial is to provide a way for you to debug projects that may run the code with different command line arguments rather than merely running a python script. This requires you to modify the launch.json file in Visual Studio Code. Microsoft provides a detailed page on how to setup and edit the launch.json, I will provide the most essential parts for you to get started on the debugging journey.
Setting up Debugger
After installed Python and Visual Studio Code, you need to install the python plugin within VS Code, this plugin provides extra functionalities including a debugging tool which saves you a lot of time when you are trying to figure out the problem in you code. You could get to this point by clicking the extensions icon from the left side Activity Bar.
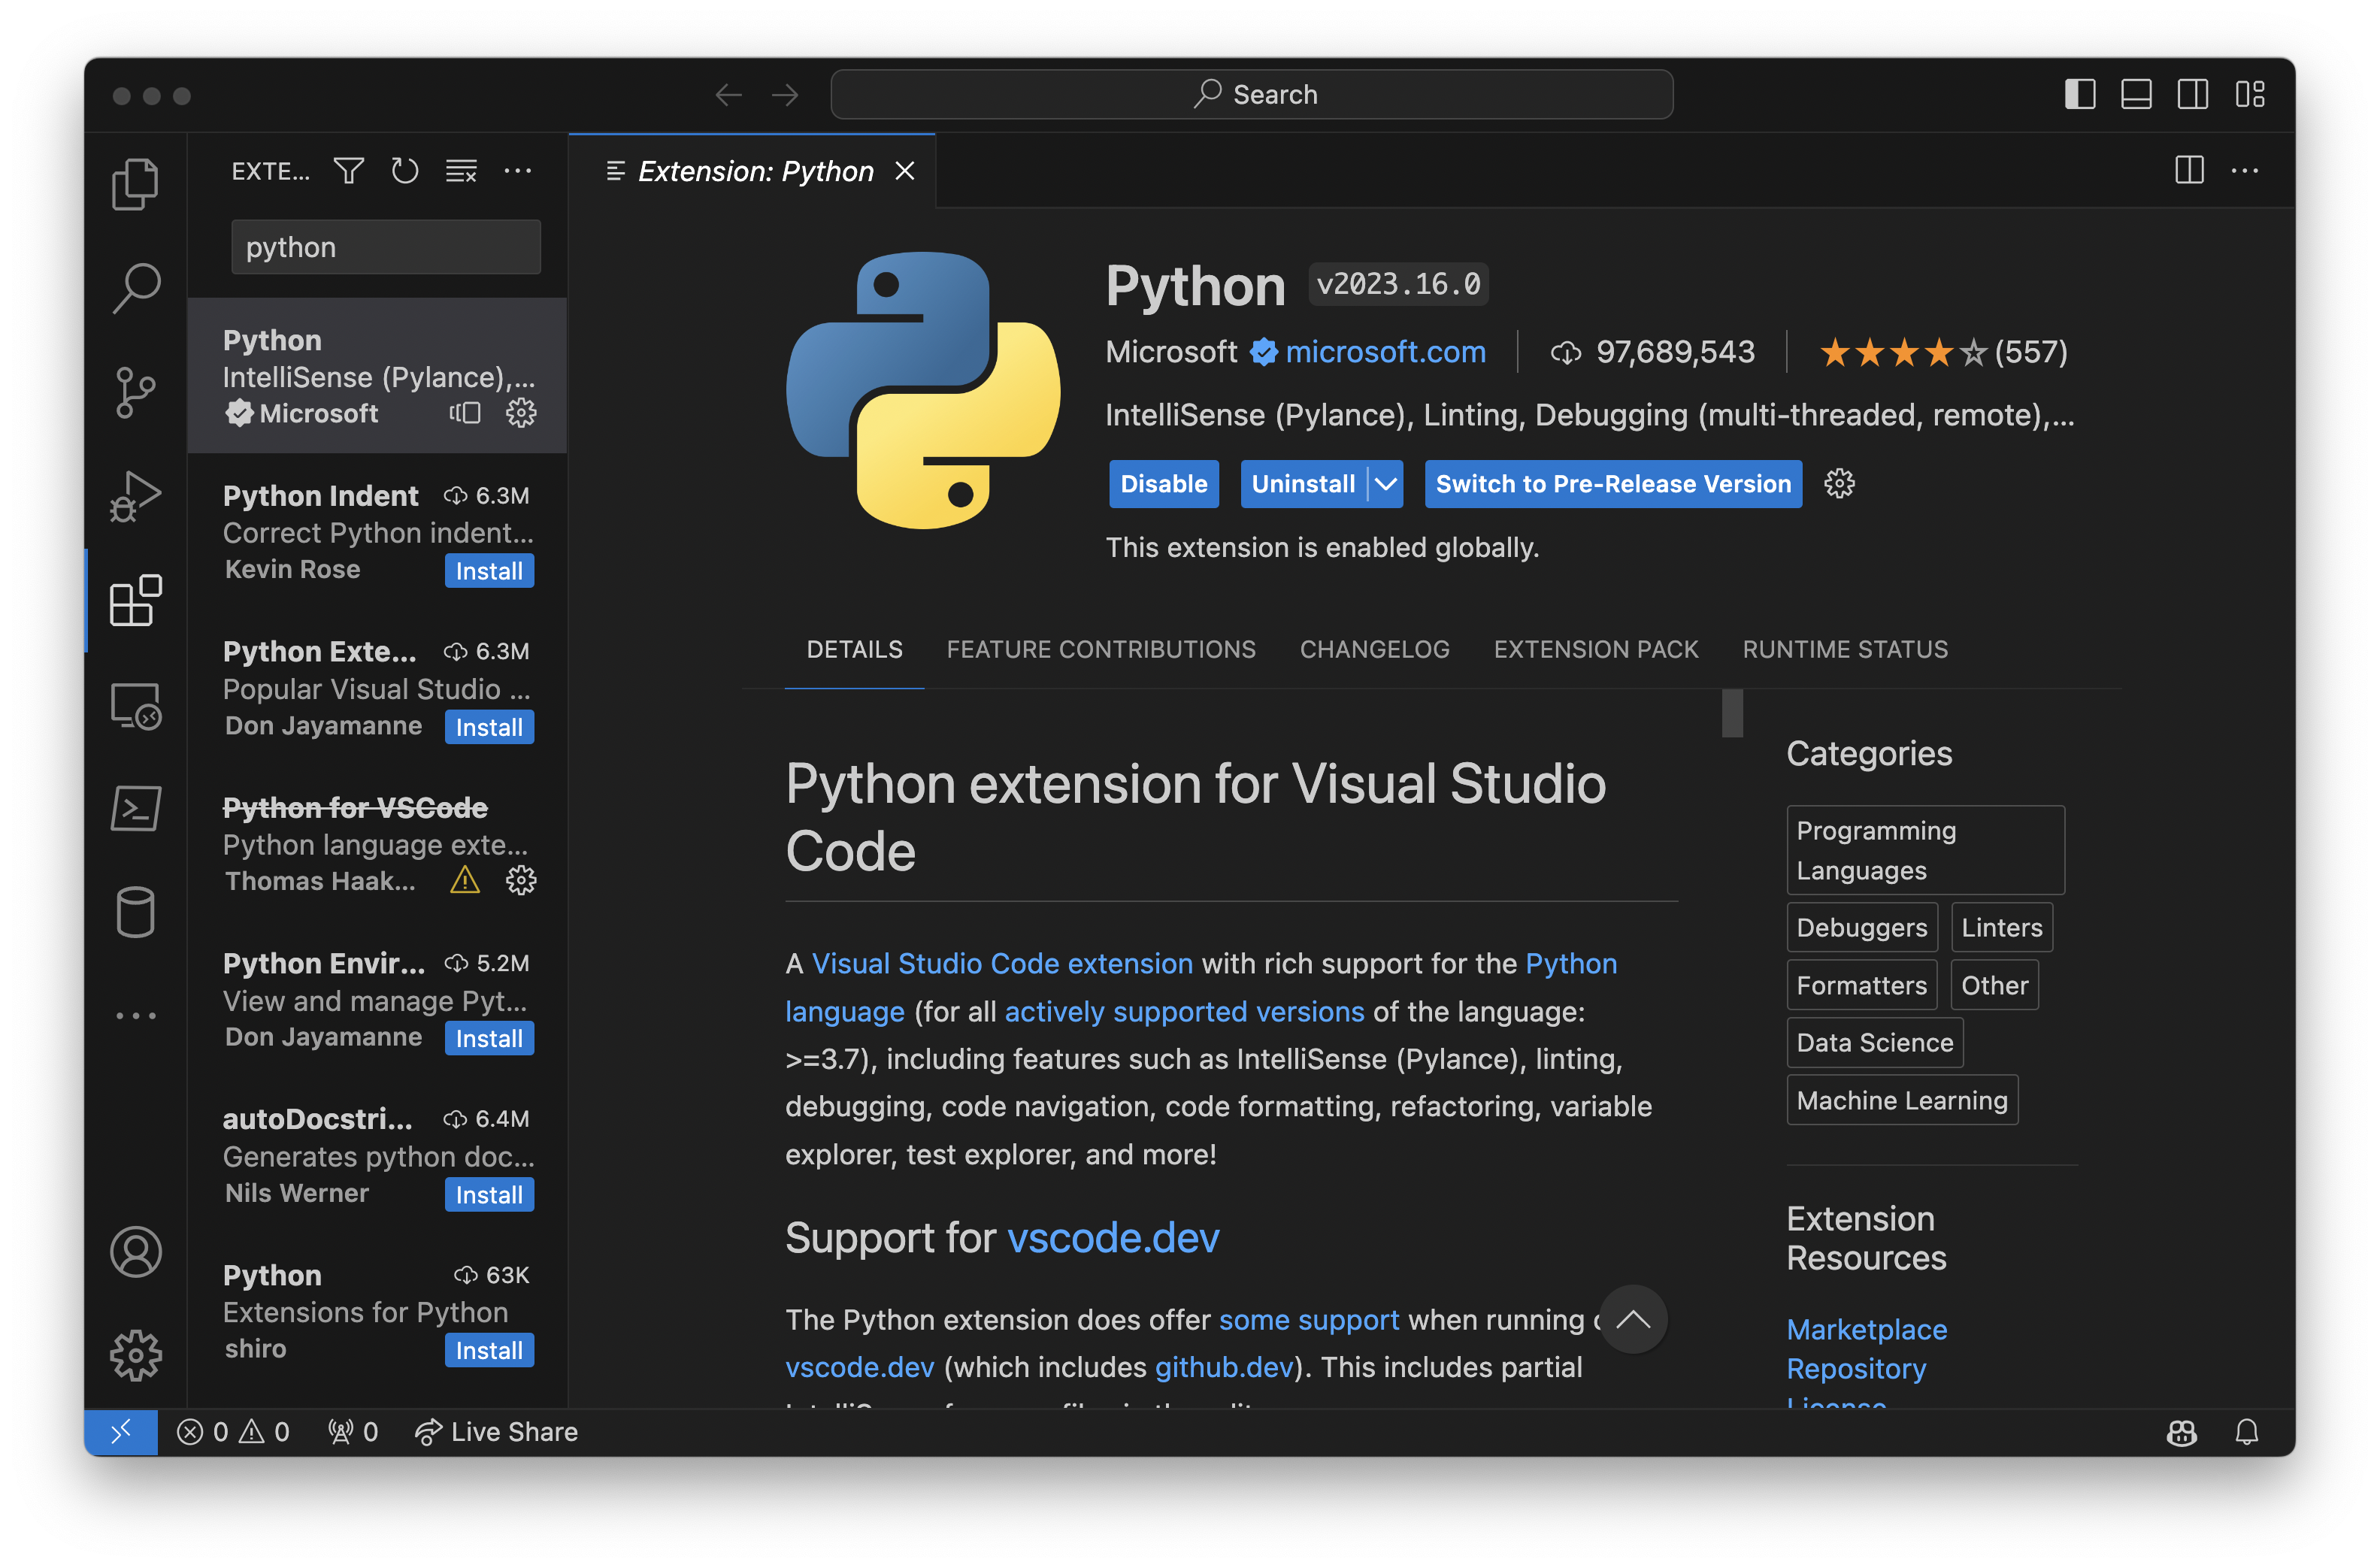
Before you want to start debugging a project, you need to make sure to open the folder of that project using VS Code, otherwise it would not understand which working directory you want to use and there will be problems regarding that.
We consider the AI Pacman Project as an example in this tutorial:
After opening up the project and click the debugging icon in the left Activity Bar, the debugging interface is provided. You can see from the left side that if there’s no launch.json, VS Code would ask you to create one, you only have to click “create a launch.json file.”
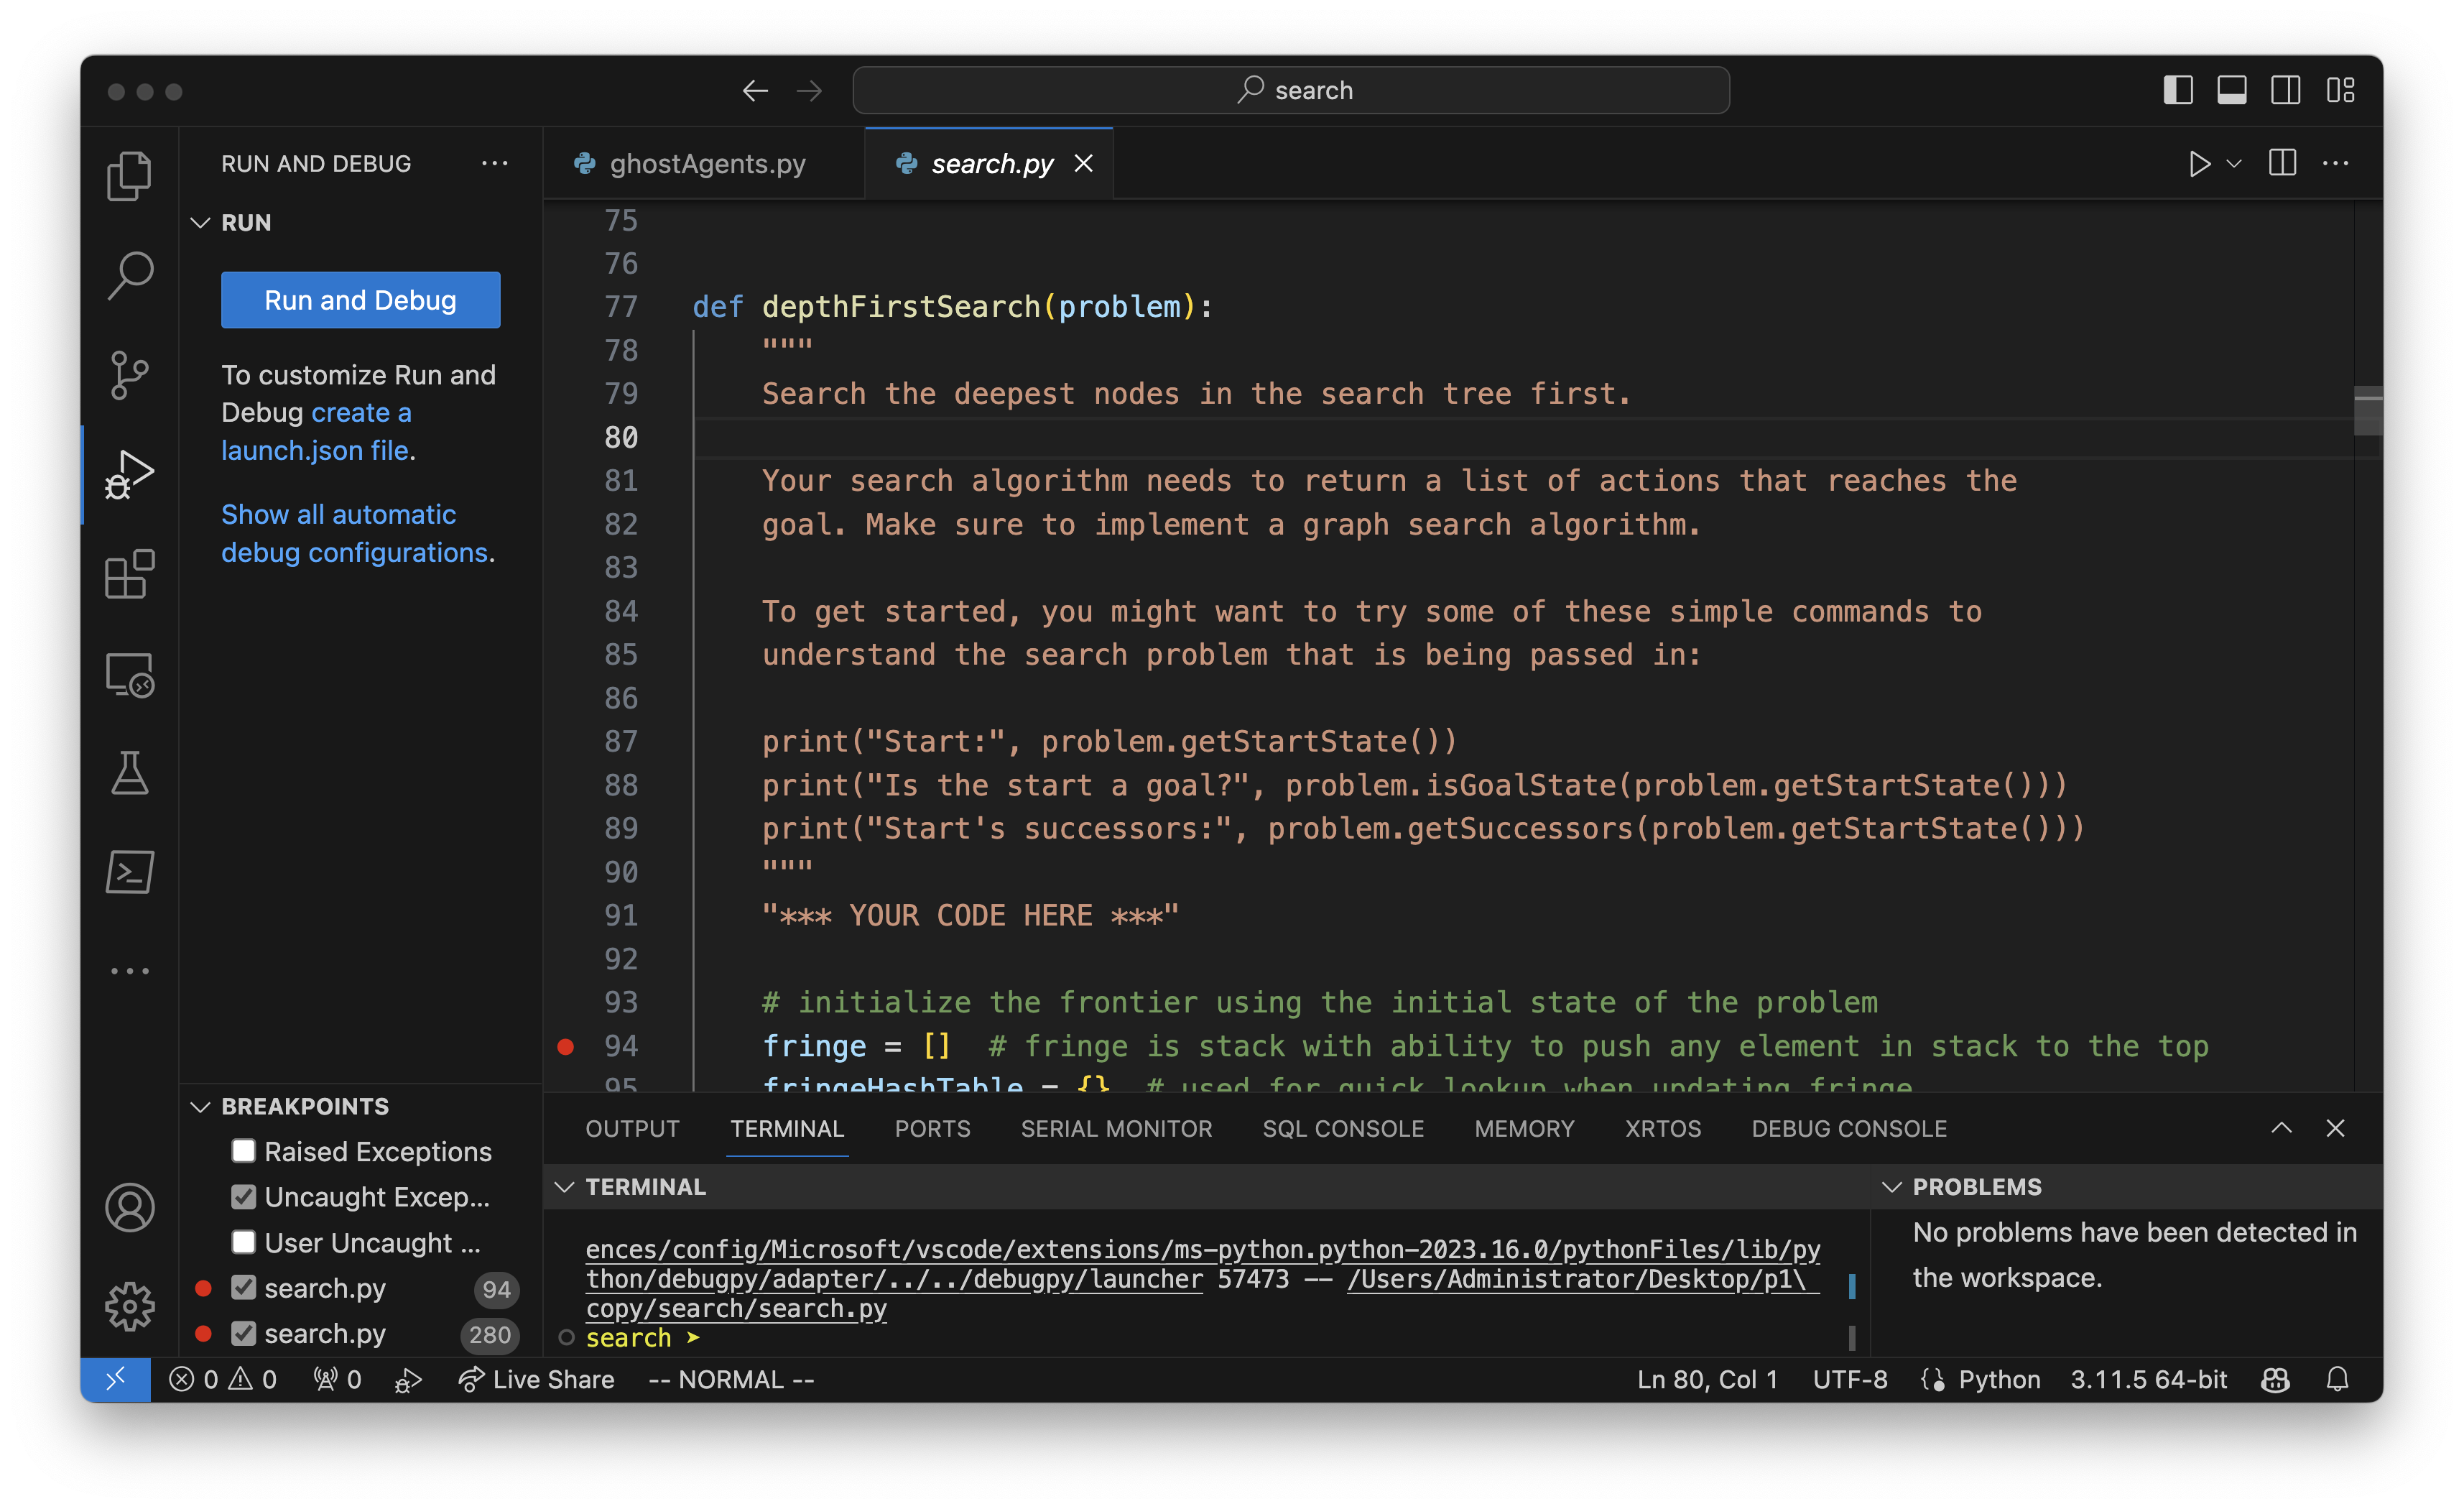
Now, you are going to edit the file and it would be poped out into VS Code automatically, I will only show the essential parts of the configuration file for you at this time.
Suppose we only care about the following two commands to run in AI Pacman:
python pacman.py -l bigMaze -z .5 -p SearchAgent;
python autograder.py -q q1;
We need to add the following blocks on to the launch.json
        {
            "name": "Python: pacman.py DFS Q1",
            "type": "python",
            "request": "launch",
            "program": "${workspaceFolder}/pacman.py",
            "args": ["-l", "bigMaze", "-z", "0.5", "-p", "SearchAgent"]
        },
        {
            "name": "Python: pacman.py Autograder Q1",
            "type": "python",
            "request": "launch",
            "program": "${workspaceFolder}/autograder.py",
            "args": ["-q","q1"]
        },
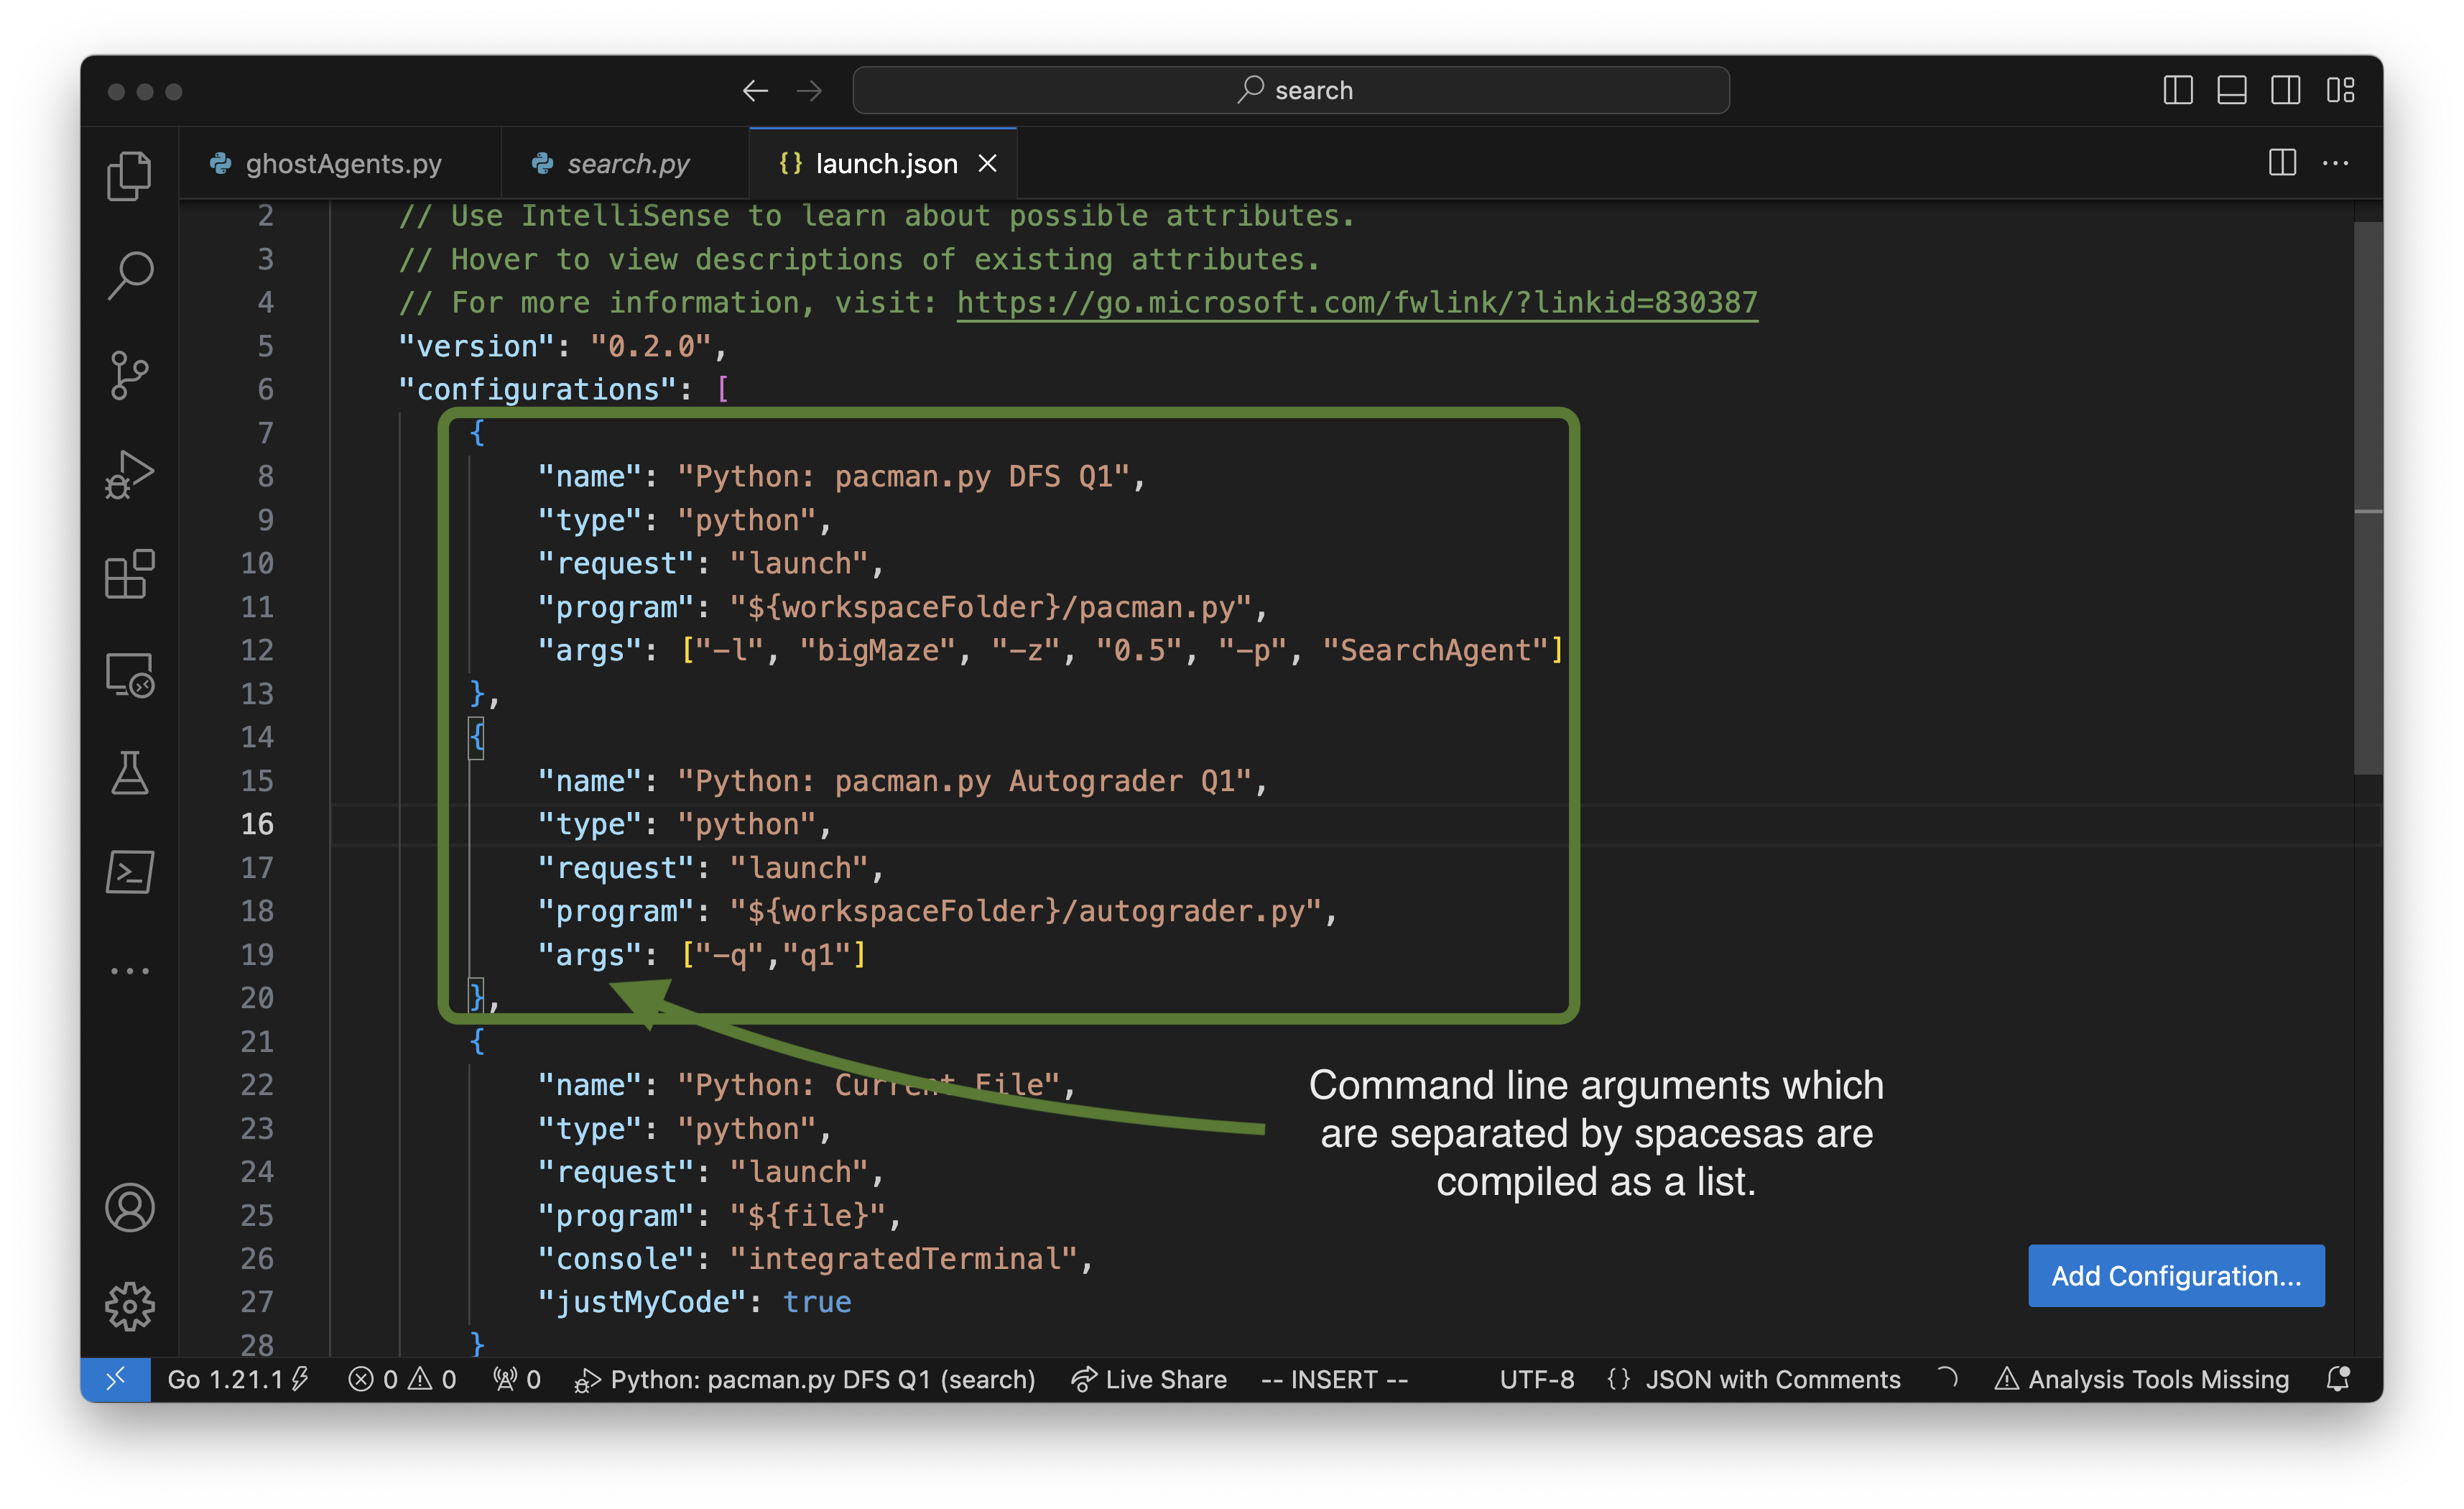
As this is a json file, you need to take care of the commas after each lne excluding the last line inside the curly brackets. You could refer to the above code snippets for configurating the json file, just to make sure you check the configuration snippet as well as the commands we intent to run above the configuration snippet. A few things that we care about in the snippets:
- name: you need to set the name of the debugging profile for your project which will be shown later.
- type and request should not be changed.
- you need to make sure which python script to invoke at the program line.
- the args line allows you to pass the whole list of arguments to the debugging profile.
The following screenshot shows what it looks like in launch.json.
After you’ve done editting we could setup the break points and then click the debug button from the left Activity Bar.
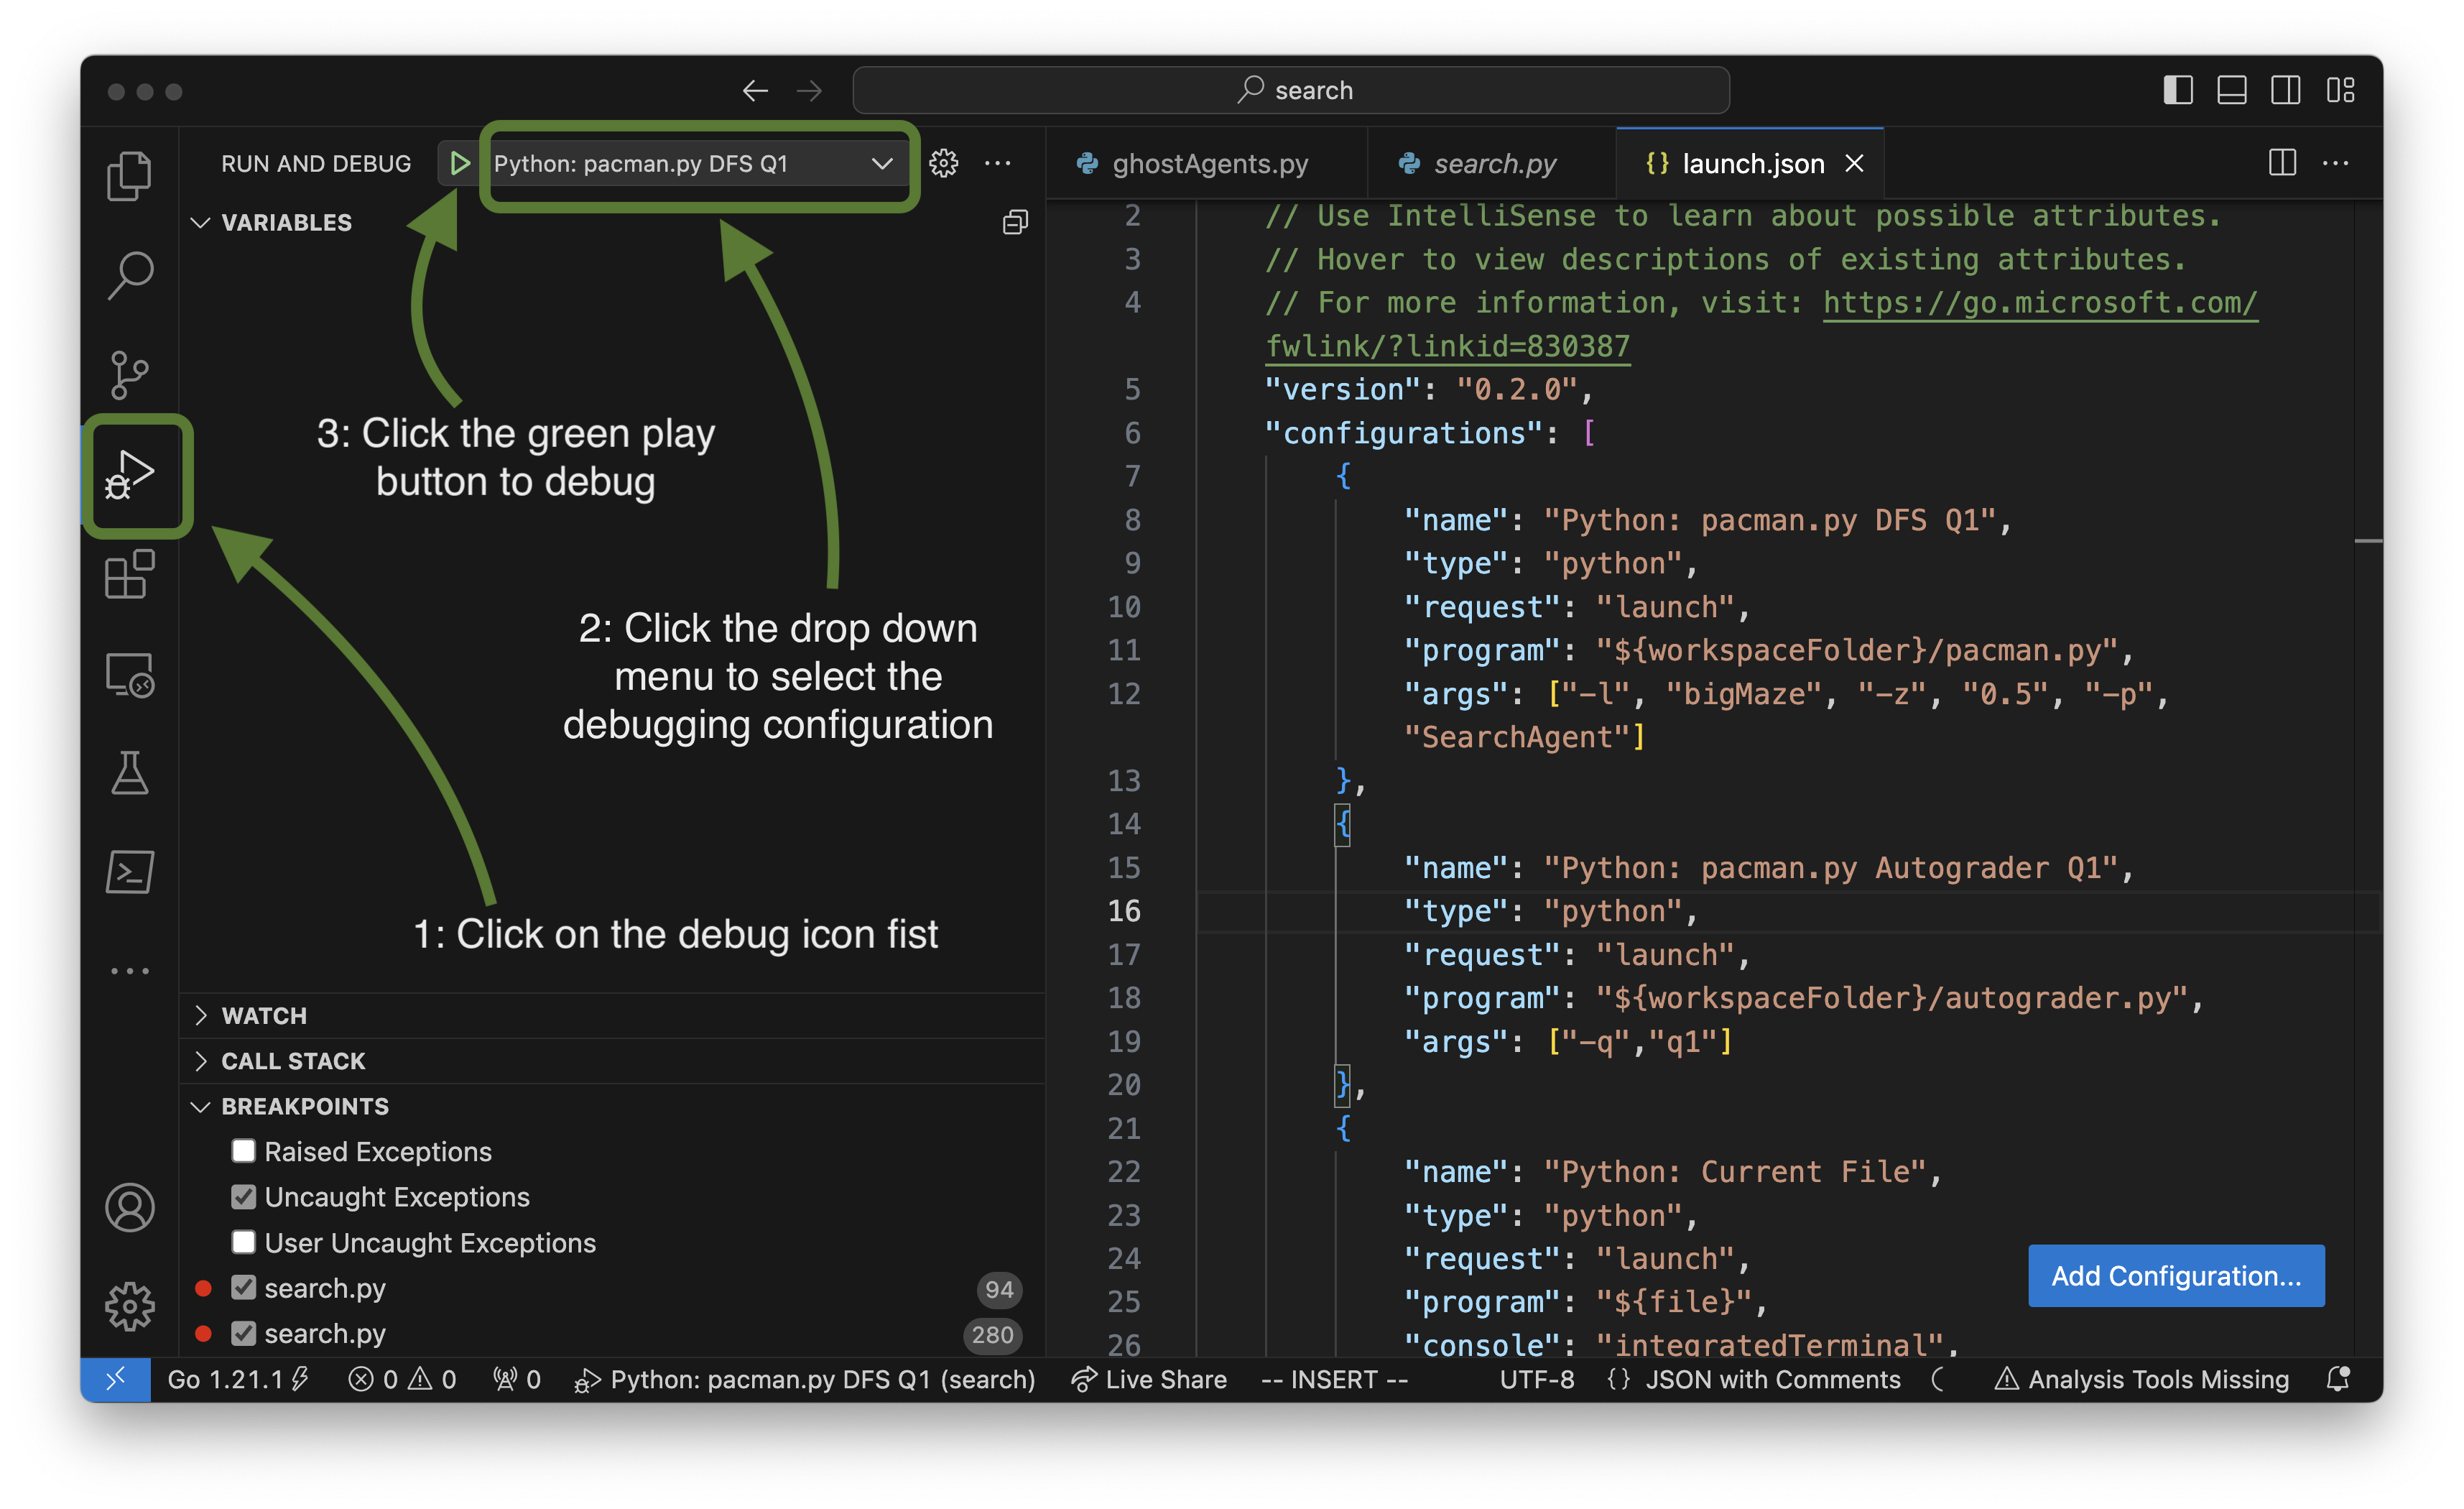
When you click on the drop down menu you can find out there are multiple profiles you could choose from, in this tutorial we choose the DFS Q1 one. The name is based on the launch.json we just modified.
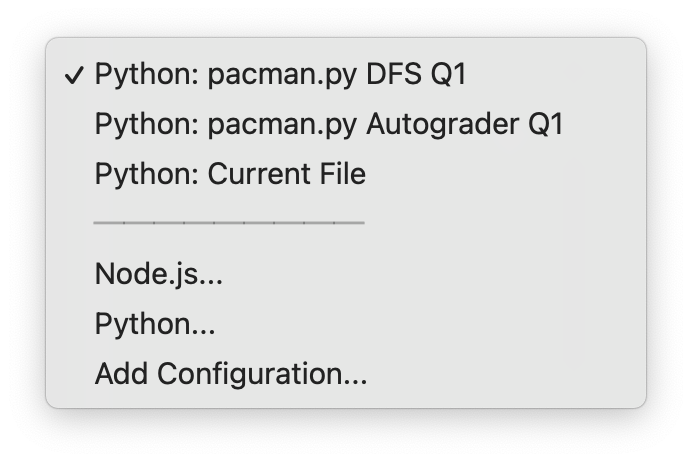
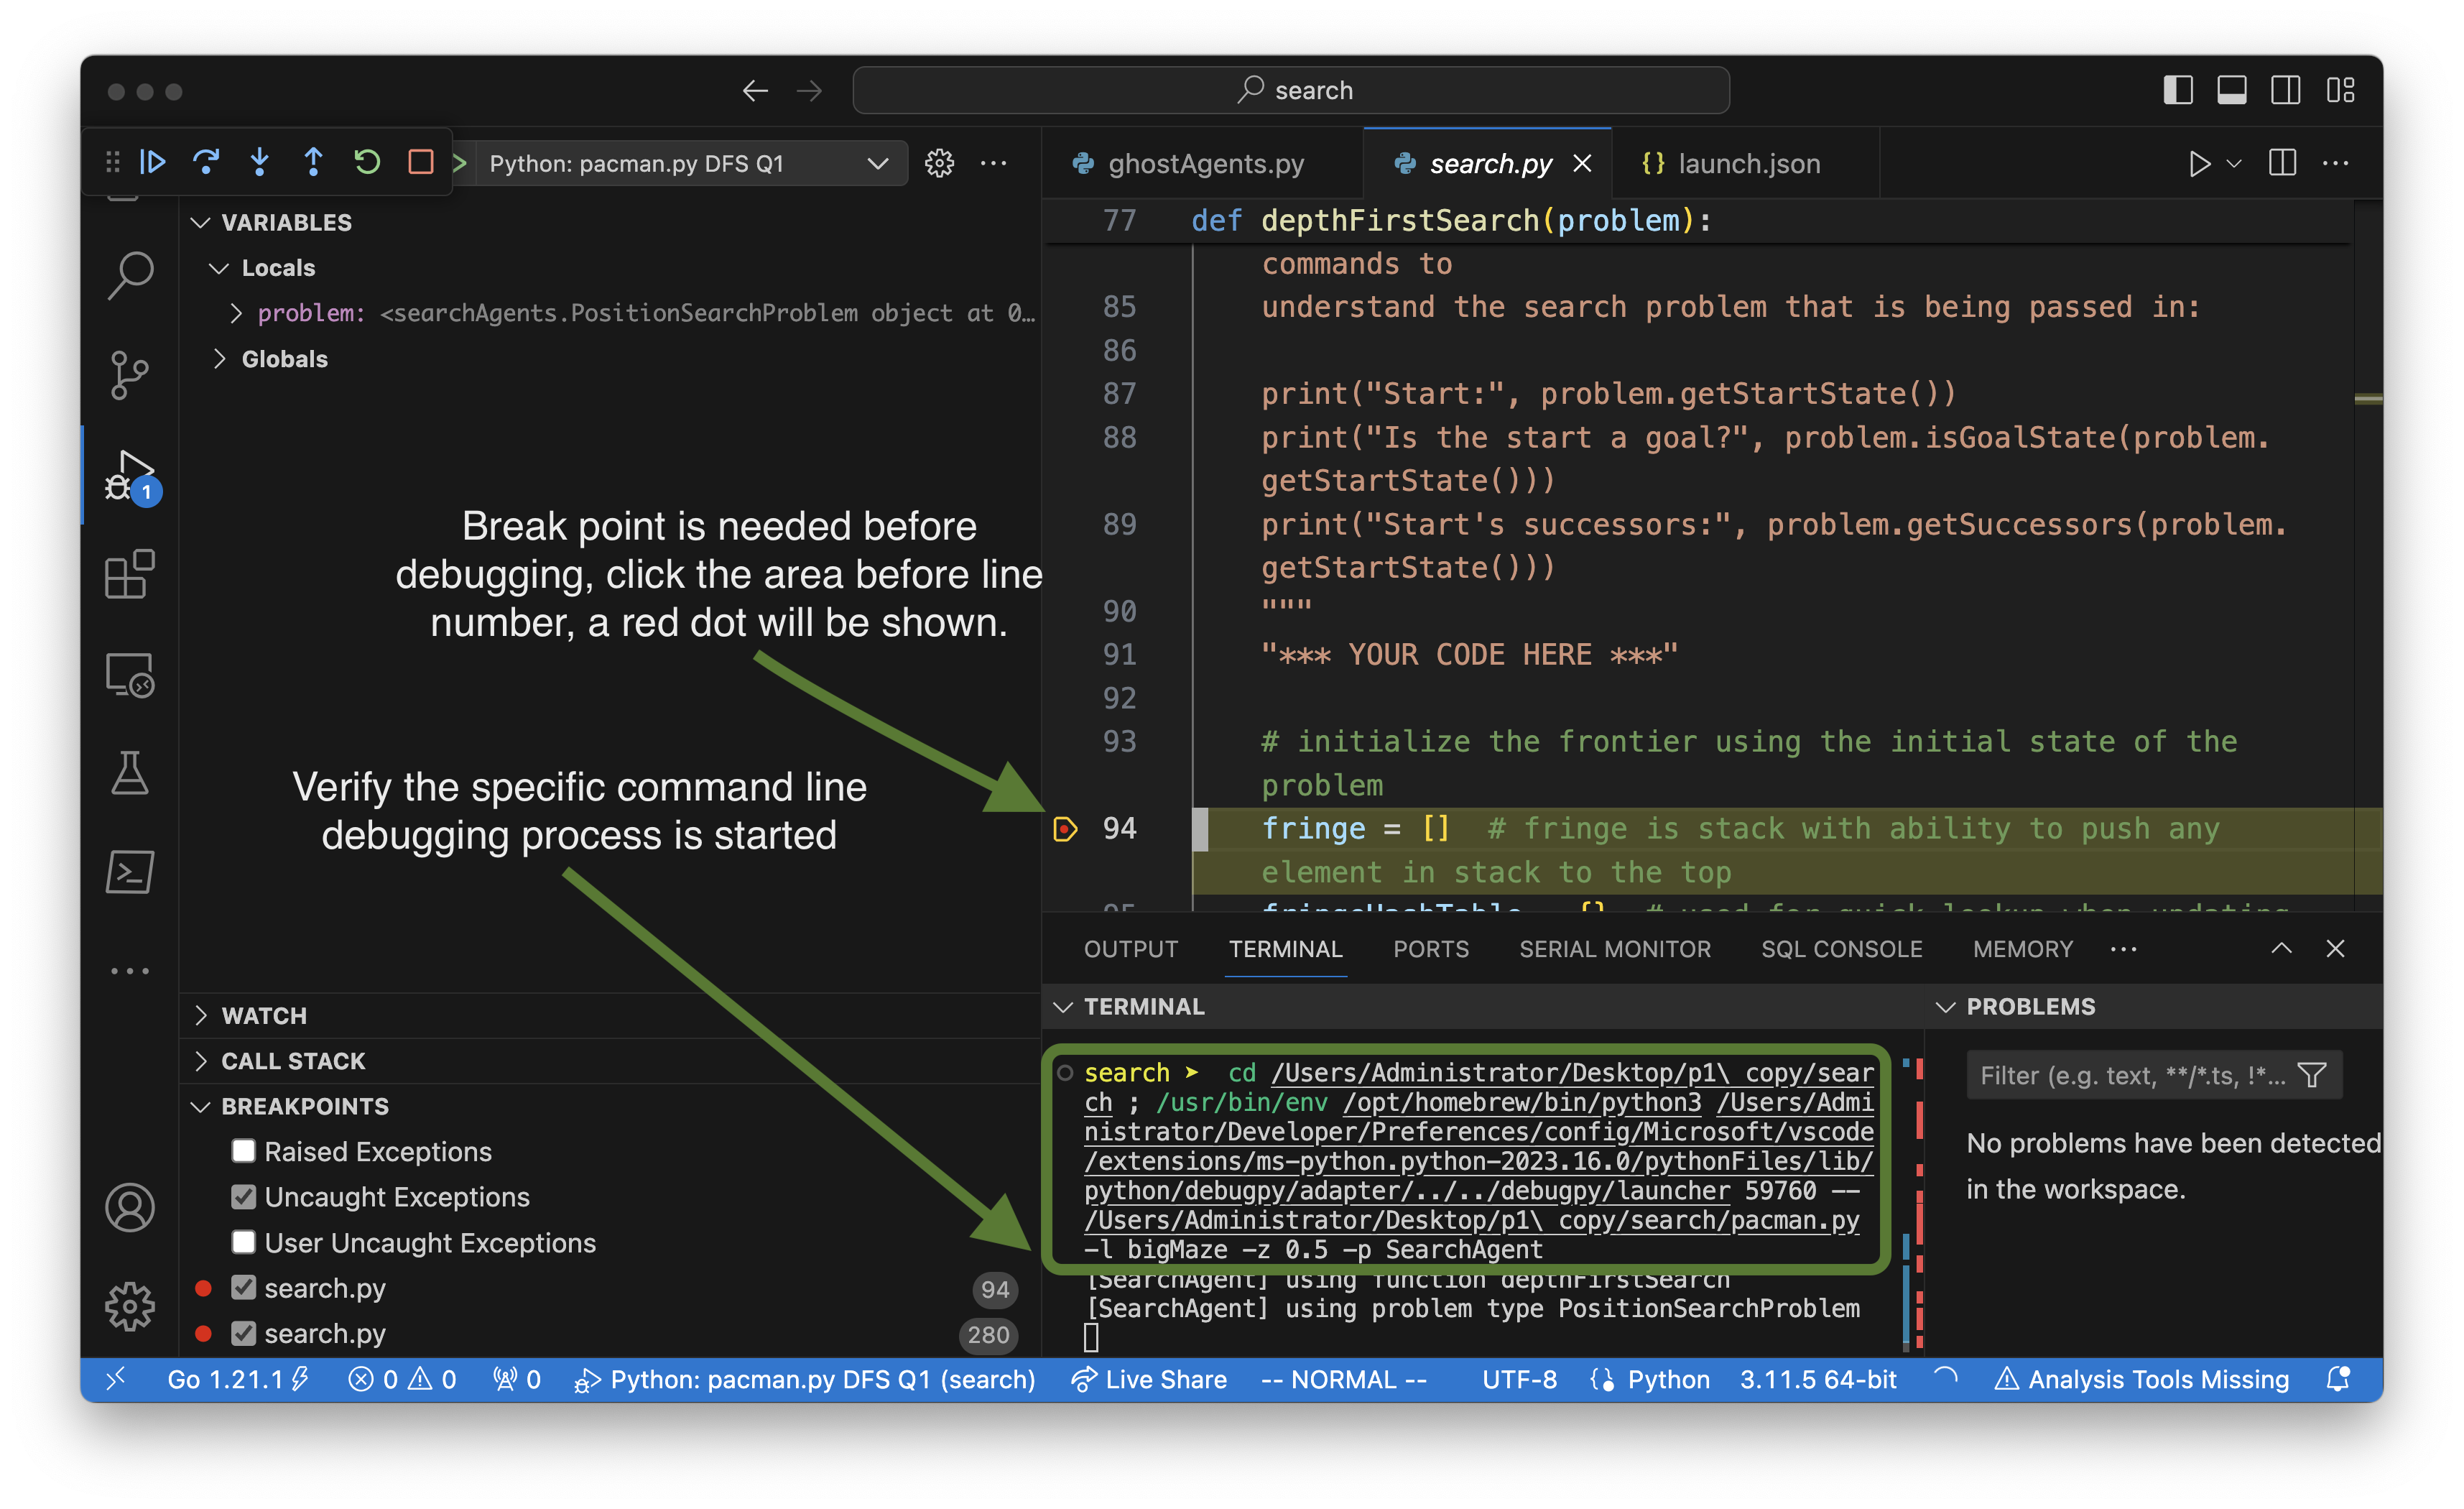
After we click the green “play button”, the debugger begins to debug our program, if you set the configuration file correctly and you place the break points at the correct region of codes. You can verify that the intended arguments are passed into the debugger by checking the Terminal shown inside the following figure. Now you could use the debugging tools shown at the upper left of the figure.
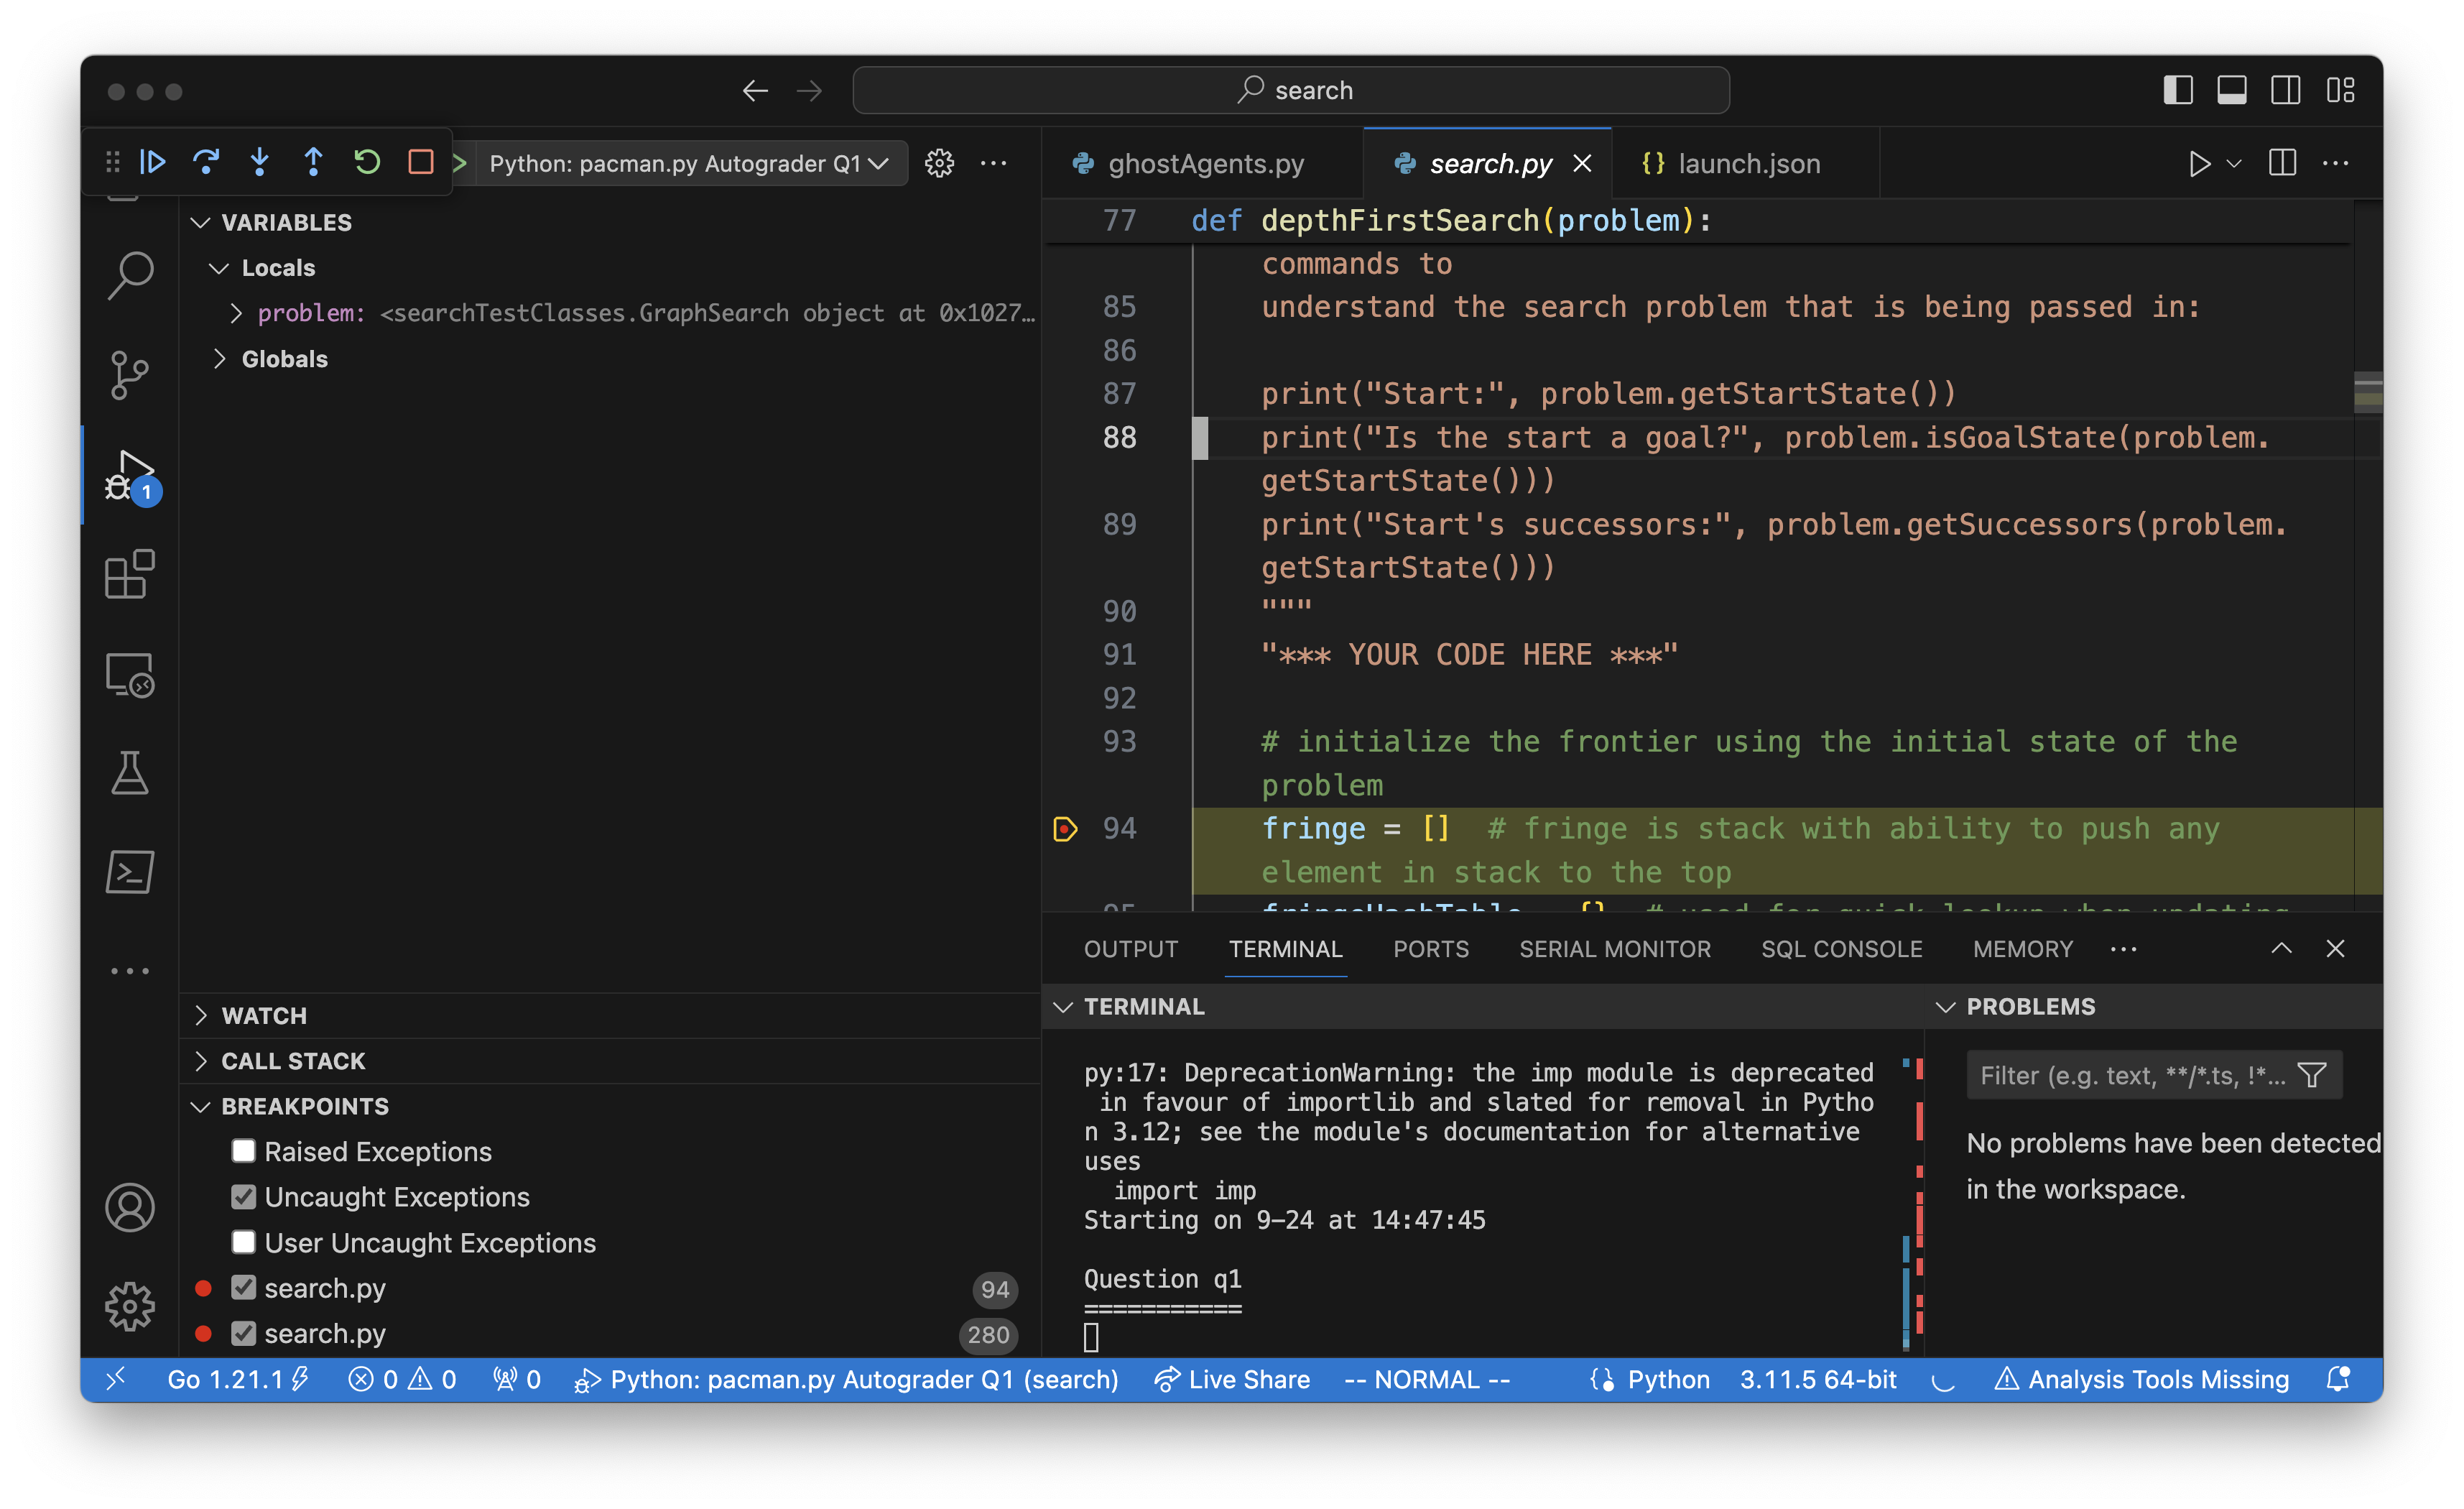
We could also try the other debugging profile regarding autograder on quesion 1:
Conclusion
this is a tutorial on how to config the launch.json for python projects that is able to debug the program using based on specific command line. After the setup is done, you could be able to test the functions you may want to deal with.
PS: I recommend you to read the book “Visual Studio Code Distilled”, you could find it in the library with free access.
Leave a Reply